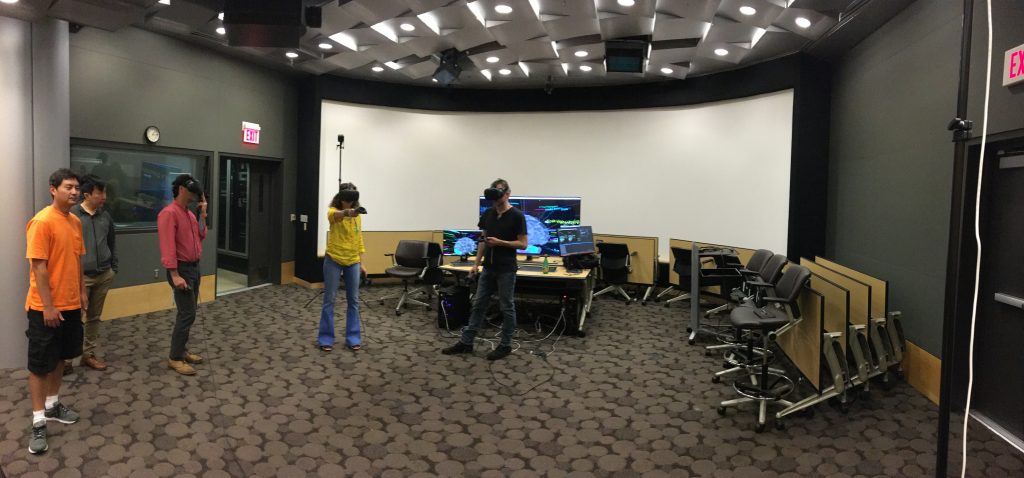
Dr David Shattuck’s VR experience has manifested the virtual reality classroom that we’ve all envisioned in one form or another. The work is the culmination of 20 years worth of research and coding, and presents brain imaging and analysis in a futuristic VR environment. As with other posts, I will do my best to explain Dr Shattuck’s work, but perhaps more than any other lab, this one is something that you just have to interact with for yourself. Words will, inevitably, fail to capture the full experience. Pictures will also fall flat, as I was only able to take pictures of the various PC monitors that displayed what users were viewing in the environment. (At the bottom you’ll find a video that does a better job at capturing a slice of the experience.)
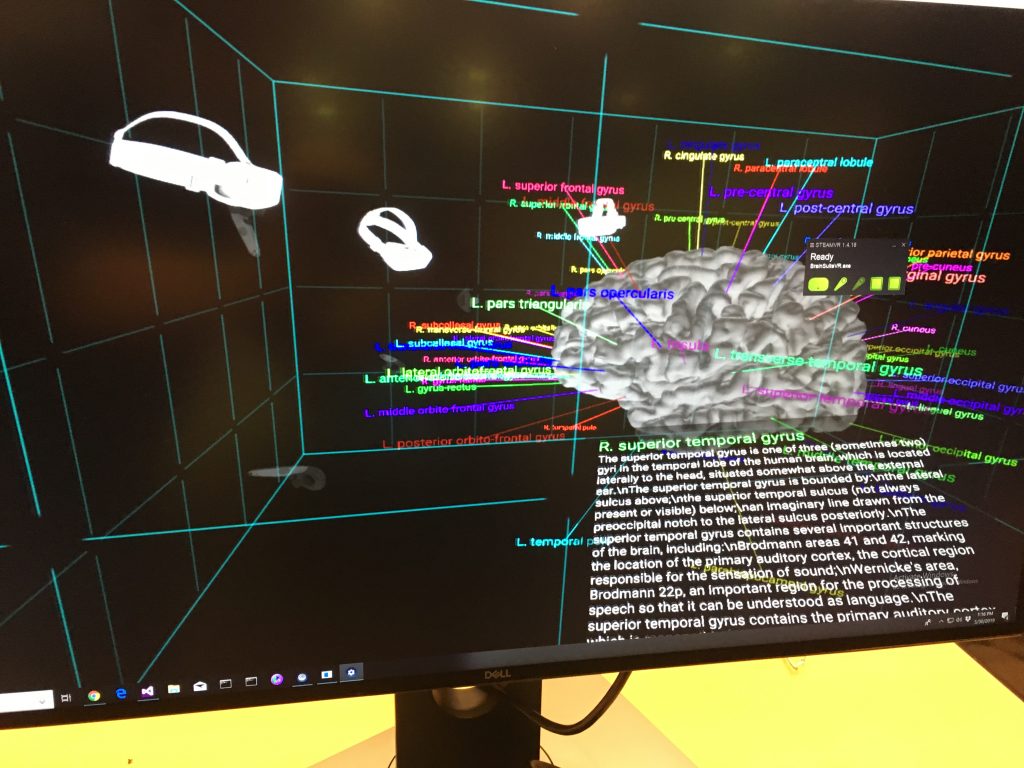
The first thing you’ll notice about this environment is the jumble of text. A few things to note here: first, the labels can be toggled on and off. The text in the foreground is displayed only for the user who selected that particular section. The colored labels actually rotate to face the users as they walk around the brain. Lastly, and perhaps most impressive, the labels are automatically generated by software that Dr Shattuck has written. (Again, this is the product of 20 years of work. I almost said culmination, but I dare say that Dr Shattuck is not quite finished.)
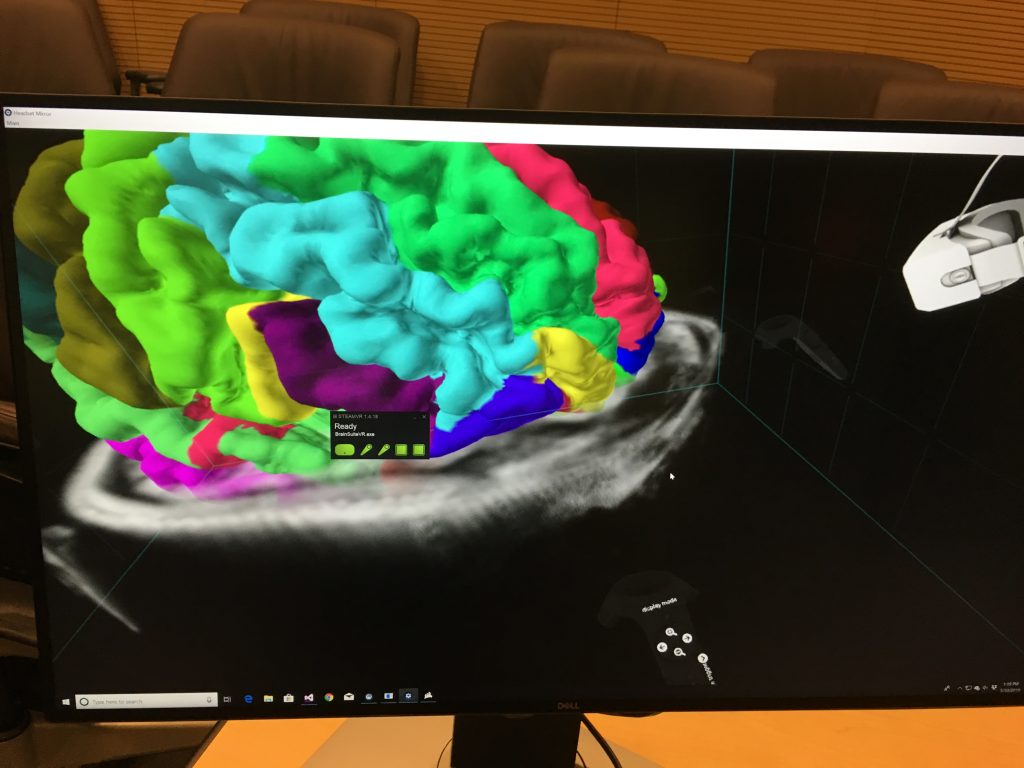
One of the features of the environment that was difficult to capture in a photograph was the way in which Dr Shattuck can manipulate that 2-dimensional MRI scan. With his controller, he is able to manipulate it in any direction, offering users a glimpse at a slice of the brain in any position. Impressively, Dr Shattuck told us that all of the necessary MRI data can be collected in under 30 minutes, and with powerful workstations this data can be used to generate all of the assets that we saw in the environment in 2-3 hours. And, of course, this timeframe will only become shorter as hardware improves.
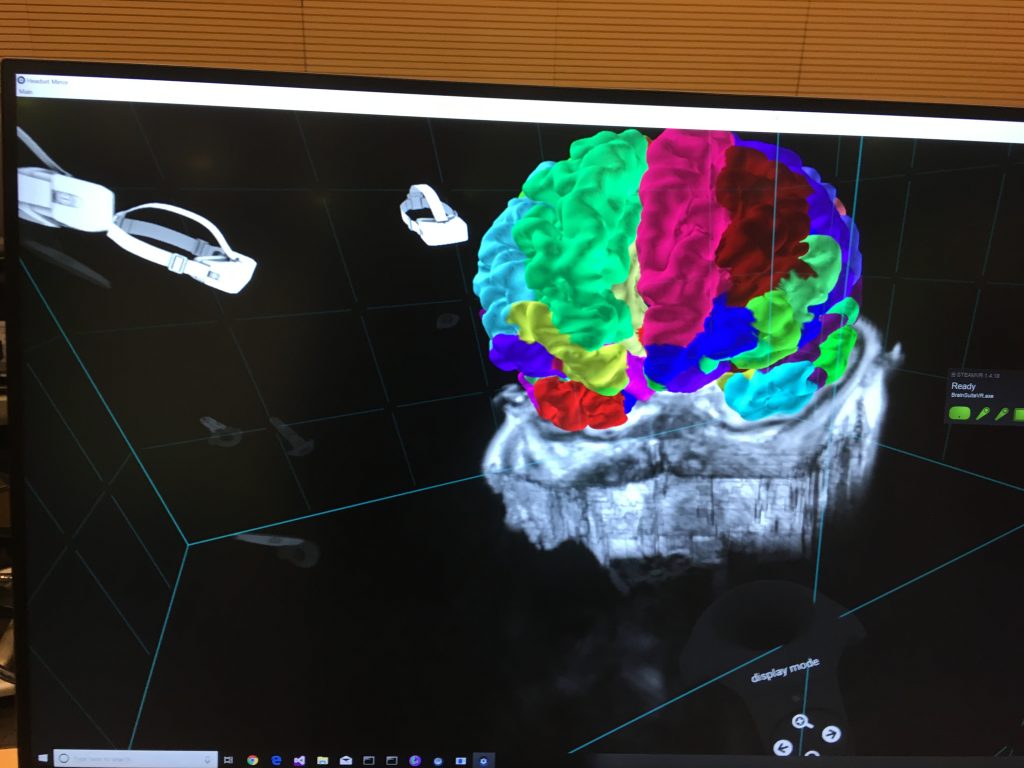
The quick turnaround time to translate MRI data into these virtual assets is a huge plus. Neurosurgeons, for example, can use this software for neurosurgical preparation, quickly generating individual patient’s MRI data in an interactive, 3D environment. The software also allows for users to be in separate locations, so a future where neurosurgeons can use this environment to consult with other doctors is already here.
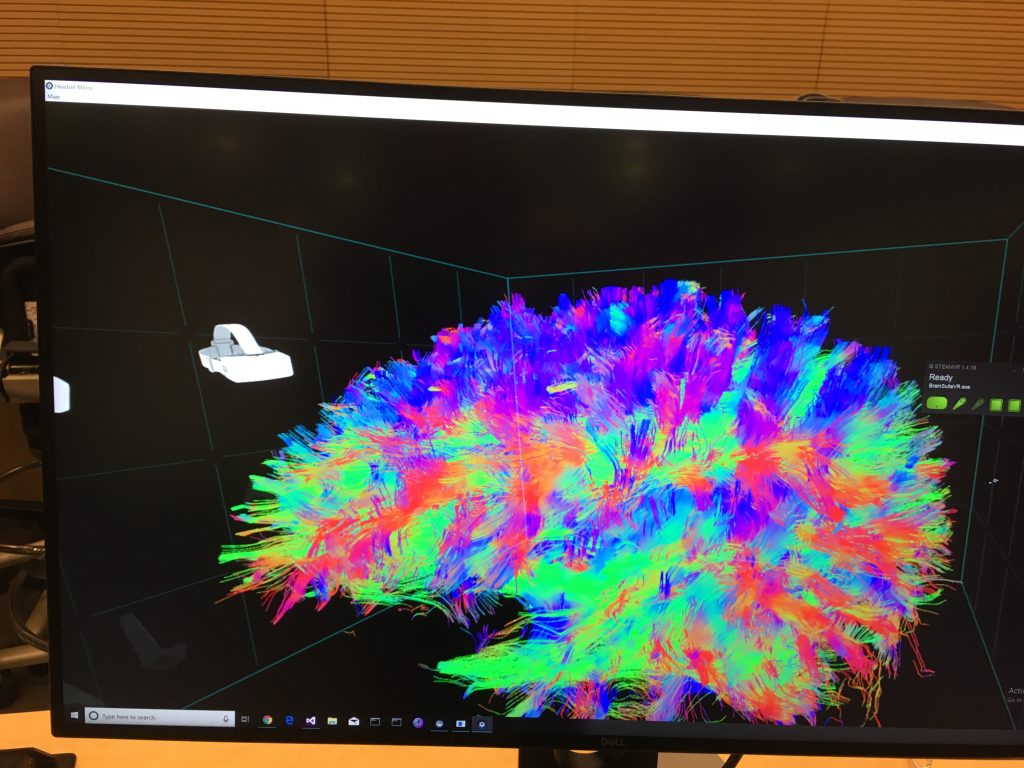
Another visualization of the brain that Dr Shattuck can offer is a color coded display of neural pathways. Blue indicates up and down, Red is left to right, and Green is front to back movement. Movement in this case is a loose term, because it refers to the direction of neural pathways. Dr Shattuck has written an algorithm that can track the movement of neural pathways, tracing them as they move from one section to another.
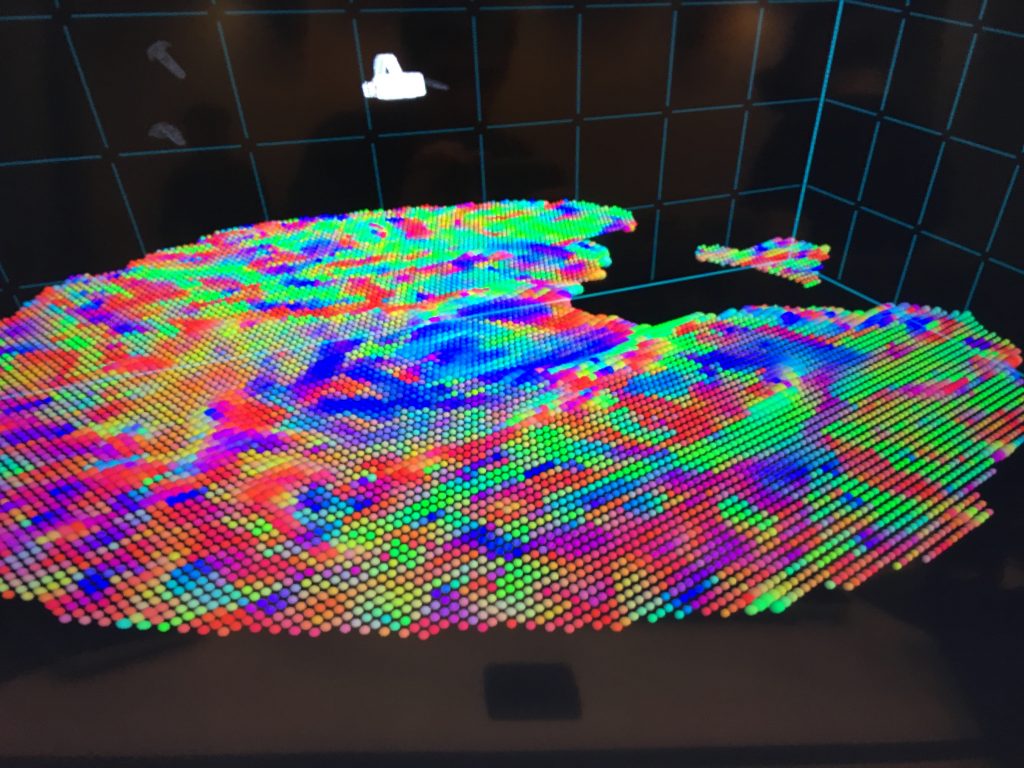
Additionally, Dr Shattuck can display slices of the brain to look at diffusion tensors. These are color-coded in the same way as described above (Blue up-down, Red L-R, Green front-back). Although many appear spherical, they are in fact elliptical, indicating the direction of water diffusion. Water diffusion, in turn, is directional, indicating the preference of neurons’ movement. This kind of inference using water diffusion is similar to what can be done with muscle fibers as well as neurons. This allows scientists to infer the neural structure of the brain; how well one colored area is connected to other areas of the brain.
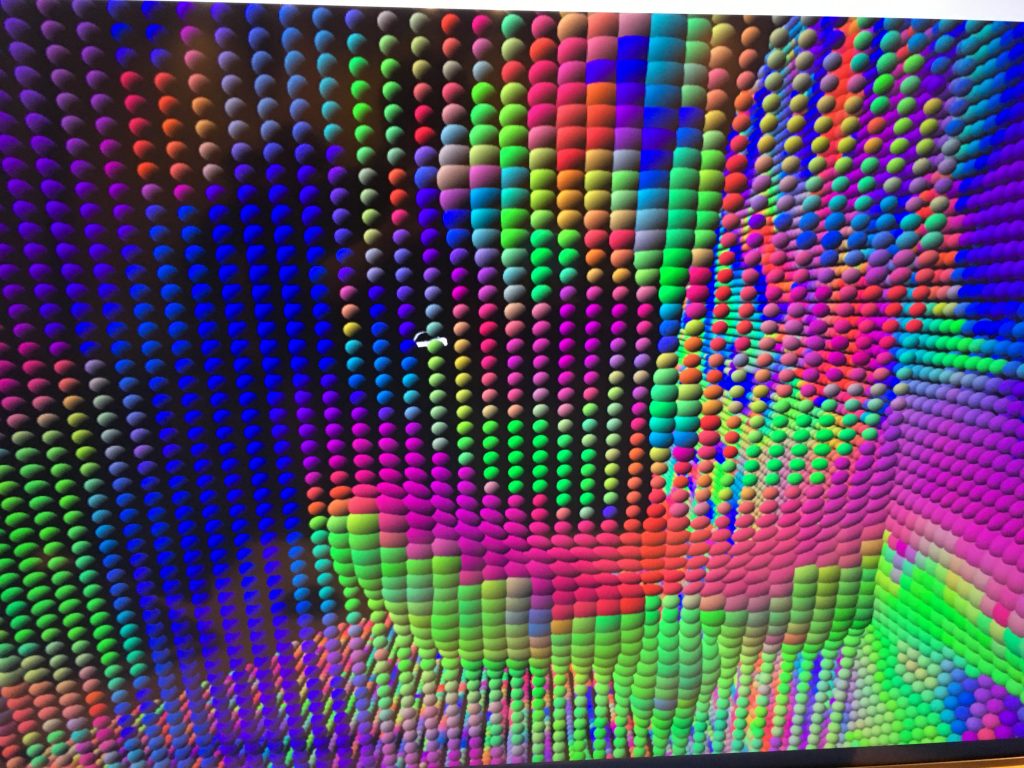
The corpus callosum, as we all know, is a large nerve tract consisting of a flat bundle of commissural fibers, just below the brain’s cerebral cortex. Just as obvious, corpus callosum is Latin for “tough body.”
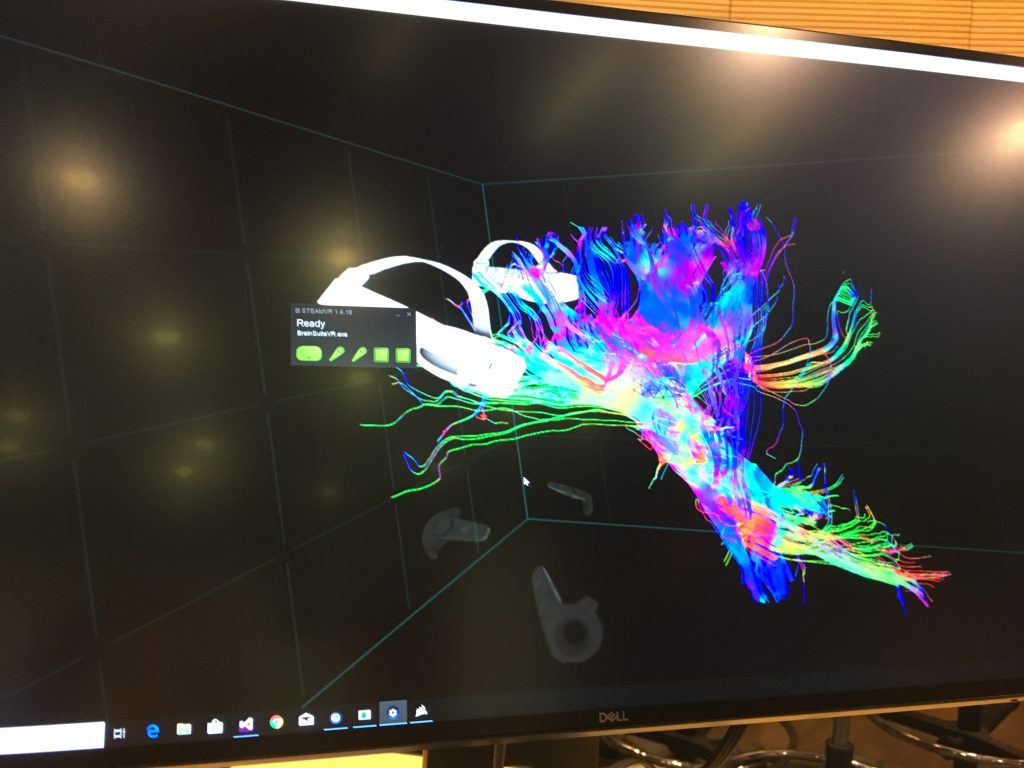
Dr Shattuck’s 20-year-long workflow can be seen first-hand at www.brainsuite.org. Originally the focus of his thesis work, Dr Shattuck has continually massaged and improved the software since obtaining his PhD, and is, in my estimation, far from done. He’s eager to explore more applications. This workflow is not limited to brains (although his custom, self-written code that automatically labels brains is, by definition, limited to brains). Dr Shattuck told us that this is theoretically possible to do with any volumetric data, from heart scans to data chips. Dr Shattuck has not yet done this with a heart scan, however, because apparently studying the most complicated object in the universe is enough.
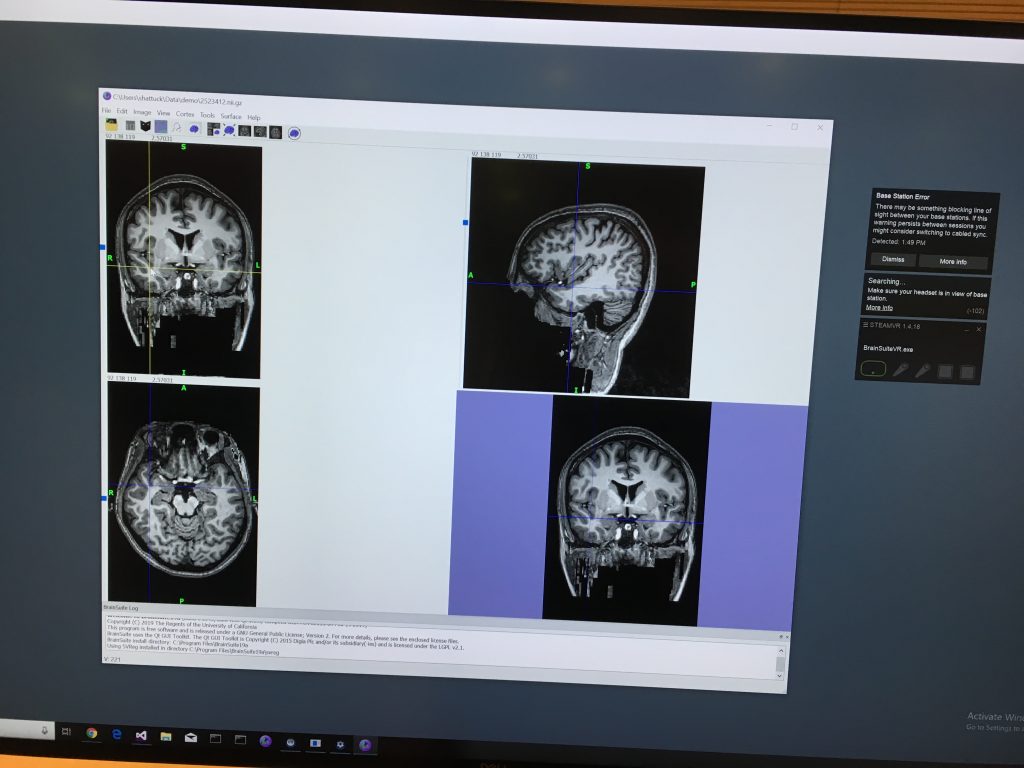
The software that Dr Shattuck has developed is available for anyone to use. Here’s a screenshot showing what it looks like with fresh MRI data loaded up. The first thing the software does is isolate the brain, automatically removing the skull and anything else non-brain.
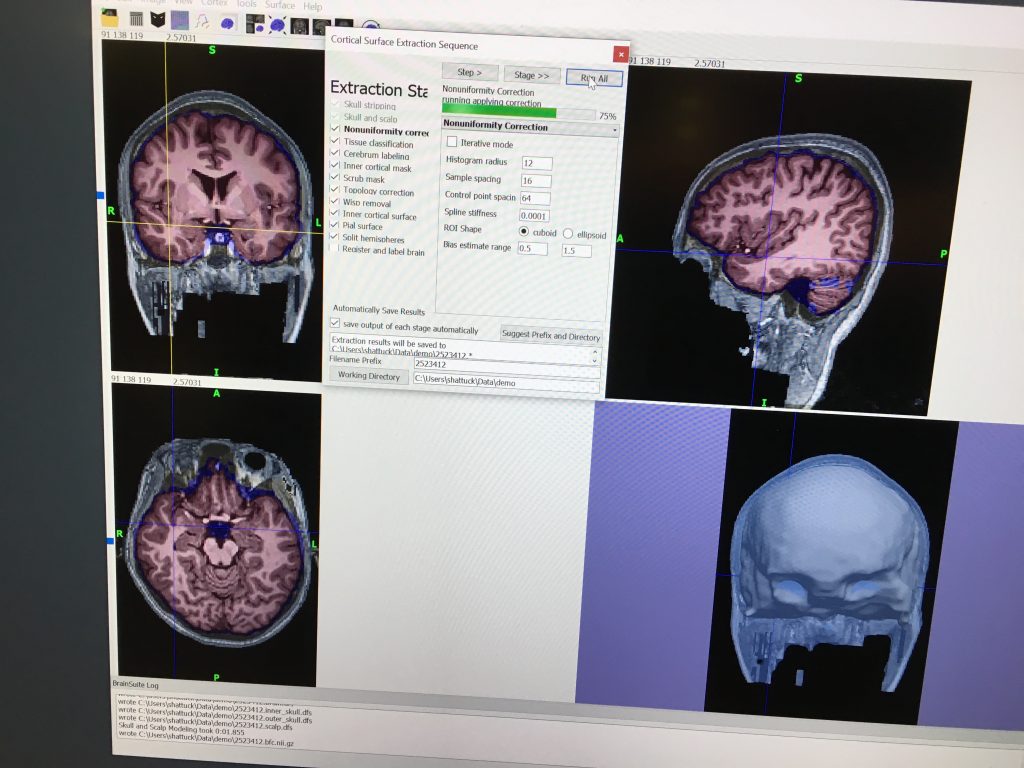
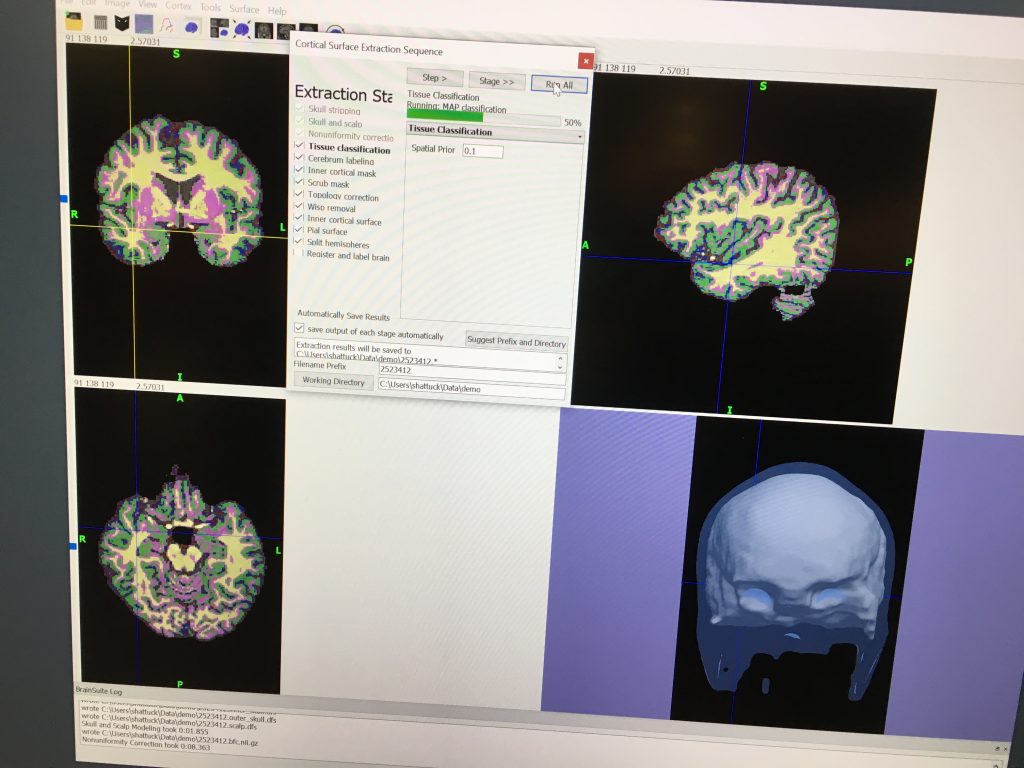
Once isolated, the software processes the MRI data scan by scan to produce the 3D model. This process is not unlike other 3D modeling processes like photogrammetry, whereby several 2-dimensional images are stitched together to create a 3-dimensional model.
The kind of shared-experience environment that Dr Shattuck has developed is everything that I had imagined an environment like this would be: extremely versatile, interactive, immediately intuitive, almost fully automated, and highly instructive. This is the quintessential example of what I envision future doctors will engage with to determine a patient’s brain health. It’s also a very useful pedagogical environment, and gives both instructors and students a look at the brain like never before.
As the software improves, it’s easy to see the myriad applications of just the brain imaging, to say nothing of other objects that can be loaded in and analysed. On a personal note, I’m very much looking forward to working with Dr Shattuck to recreate this environment across campus – with Dr Shattuck in his lab and some VR equipment loaded and ready to go in one of the Library’s classrooms. Fingers crossed he’s got the time to do that with me!
Not too long ago I had the somewhat unique experience of having an MRI scan done. Because of my access to 3D printers, I was curious about obtaining the MRI data to attempt to convert it into a 3D-print-ready STL file. I managed to get that data, and if you’ll now excuse me, I’m off to www.brainsuite.org to convert my brain into a 3D model and then print out a copy of it.
Ain’t the future grand?